
DGTG logo DGTG

Marketing KPIs 2026: Beyond Pageviews to Real Growth

Learn how to measure marketing success in 2026 with engagement, conversion, and brand lift metrics. A practical framework for founders and CMOs.
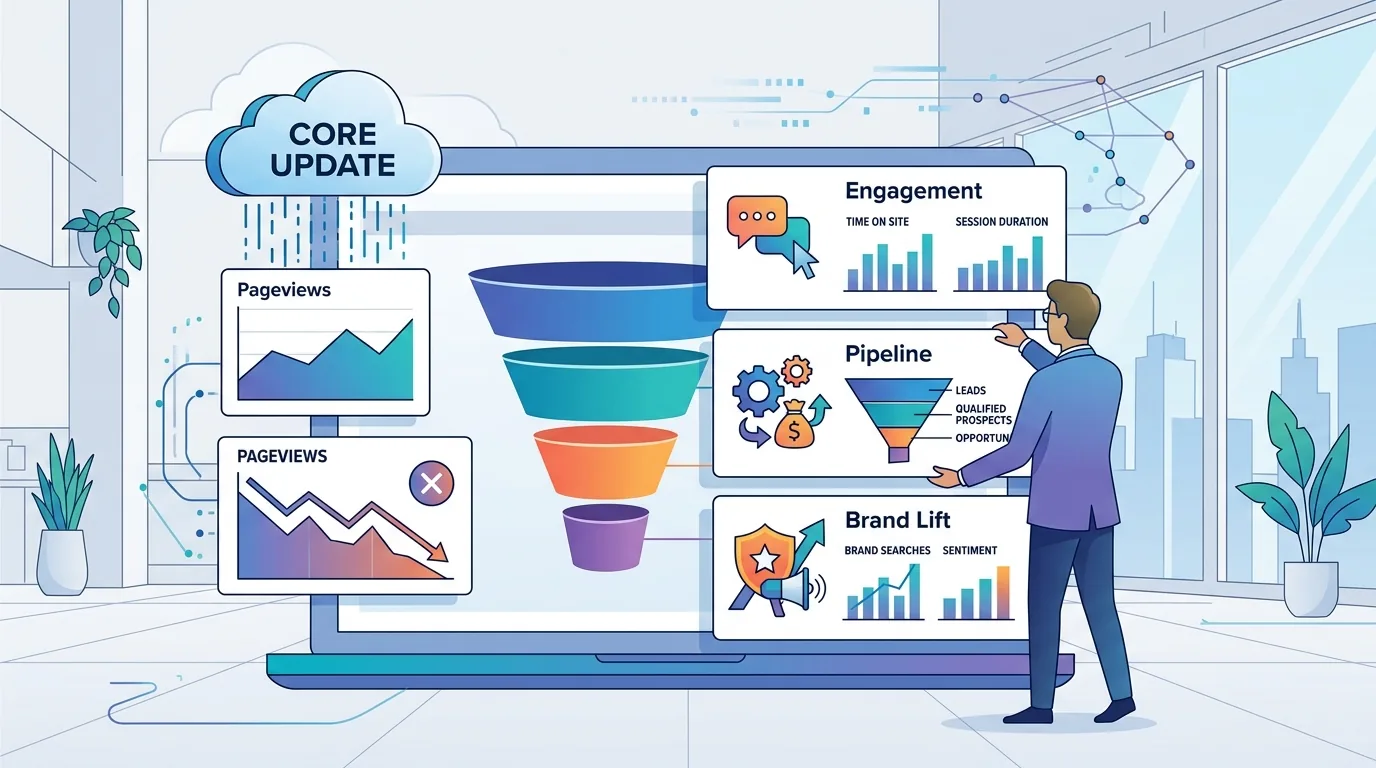
Beyond Pageviews: How to Measure Marketing Success in a Post-Core-Update World — illustrative featured image
The last time Google pushed a broad core update, a client of ours watched their organic sessions drop 38% in a week. The dashboard looked like a cliff. Panic emails followed. But here is the thing we kept coming back to in the room: their revenue barely moved. Their demo requests stayed flat. Their sales cycle didn’t lengthen. The pageviews were gone. The business was fine. That gap between what the traffic report says and what the P&L says is the entire problem with modern marketing measurement. For years, we have optimized for the top of the funnel because it was easy to count. Clicks are cheap to generate and even cheaper to report. But [Google's latest core update](/dgtg/blog/google-s-latest-core-update-a-survival-guide-for-agencies), which has hammered unhelpful content and thin pages across the web, is a stark reminder that pageviews are not a business metric. They are a volume metric. And volume is not a strategy. If you are a founder or a CMO still reporting sessions to the board, you are playing a game you cannot win. Here is how to measure marketing success in 2026, and it starts with throwing out half the dashboard you currently use. ## The Pageview Hangover We get it. Pageviews feel objective. They are precise to the decimal point. You can put them in a slide and point at them. But the core update exposed a uncomfortable truth: Google is actively demoting content that earns views without earning trust. The algorithm is getting better at distinguishing between "people landed here" and "people found what they needed." If your primary KPI is a metric that rewards accidental clicks, you are structurally incentivized to create content that performs well in a vacuum but fails in the real world. Consider the math. A typical B2B SaaS site converts organic traffic at 1% to 3% if the traffic is qualified. If you chase pageviews, you tend to write broader, shallower content. That pushes your conversion rate down to 0.5% or lower. You need double the traffic to get the same revenue. Then the core update hits, your thin content gets demoted, and you lose 40% of that inflated traffic overnight. The problem is not the update. The problem is that you built a house of cards on a metric that was never tied to outcomes. ## What Actually Matters Now The shift away from pageviews is not a philosophical preference. It is a practical response to how the search ecosystem now rewards engagement and satisfaction. Google’s algorithms use click-through rates, dwell time, and return-to-search behavior as signals. If people click your link and bounce back to the SERP, Google notices. If they click and stay, read, and navigate to a second page, Google notices that too. This means your KPIs need to reflect the behavior you want to encourage, not just the behavior you can count. ### The Core Metric Set for 2026 We recommend rebuilding your reporting around four pillars. These are not vanity metrics. They are actionable, tied to revenue, and resistant to algorithm fluctuations. 1. **Engaged Sessions (not sessions).** Define this as a session where the user stays longer than 30 seconds, scrolls past 50% of the page, or interacts with an element. This filters out the bounce-and-leave traffic that inflates your old numbers. 2. **Qualified Leads (MQLs and SQLs).** Traffic is a means to an end. A lead that fits your ICP and has expressed intent is worth a thousand anonymous visits. Track cost per qualified lead, not cost per click. 3. **Customer Acquisition Cost (CAC) Payback Period.** This is the number that matters most to your CFO. If it takes 14 months to recoup the cost of acquiring a customer, you have a cash flow problem regardless of how many pageviews you generated. 4. **Brand Lift (Search Volume for Your Name).** This is the sleeper metric. If people are searching for your brand by name, you have built equity. If your branded search volume is flat while your ad spend increases, you are renting attention, not building an asset. ## The Measurement Framework We Actually Use Here is where the rubber meets the road. You cannot just swap out one metric for another and call it a day. You need a framework that connects your marketing activities to business outcomes in a way that survives algorithm updates. ### Step 1: Segment by Intent Stop treating all traffic the same. Split your analytics into three buckets: - **Navigational:** People searching for your brand. These are your warmest prospects. Measure conversion rate and time to close. - **Informational:** People researching a problem. These are your top-of-funnel readers. Measure engagement rate and email capture rate, not pageviews. - **Transactional:** People comparing solutions. These are your bottom-of-funnel prospects. Measure demo requests, free trial signups, and sales calls booked. Each bucket gets its own KPI set. You should not be optimizing them for the same outcome. ### Step 2: Track Engagement Quality, Not Quantity Use scroll depth and time-on-page as a proxy for content quality. But be careful. Time-on-page is a flawed metric because a user might leave a tab open for an hour. We prefer a composite score: | Signal | Weight | | --- | --- | | Scroll depth > 75% | 40% | | Click to secondary page | 30% | | Comment or share | 20% | | Return visit within 7 days | 10% | Anything scoring above 70 on this composite is doing its job. Anything below 40 is a candidate for a rewrite or a redirect. ### Step 3: Tie Content to Pipeline This is the hardest part, and it is where most agencies drop the ball. You need to track which content assets are associated with closed-won deals. This requires a CRM integration and a disciplined tagging system. In our experience, the content that wins deals is rarely the content that gets the most traffic. A technical comparison guide that gets 500 visits a month will close more deals than a viral listicle that gets 50,000. The listicle builds awareness. The comparison guide builds pipeline. Both are valuable, but they serve different purposes and need different metrics. ## What We Recommend If you are rebuilding your measurement stack, here is our opinionated take on the tools and tactics that work. **For analytics, move to a tool that supports event-based tracking natively.** Google Analytics 4 is the obvious choice, but most people use it wrong. Set up custom events for scroll depth, video plays, and form interactions. If you are still looking at the default "Engagement" report, you are missing the point. We also like Plausible or Fathom for lightweight, privacy-friendly tracking if you are a smaller team that does not need the full GA4 complexity. **For attribution, stop using last-click.** It is 2026. If you are still crediting the last touchpoint with all the revenue, you are systematically undervaluing your top-of-funnel work. Use a blended model or a multi-touch model that gives partial credit to awareness content. This will shift your budget allocation and force you to care about the metrics that actually matter. **For brand lift, use Google Trends and your own search console data.** Track branded query volume monthly. If you run a campaign, watch the delta. It is crude but effective. For a more precise read, consider a brand lift study on YouTube or a survey tool like Qualtrics, but only if you have the budget. **For in-house vs. agency:** If your team is under five people, you cannot build a robust measurement stack in-house. [Hire an agency](/dgtg/blog/how-to-choose-a-digital-marketing-agency-in-2026-7-must-ask-questions) that has done this before. If you are larger, build a dedicated marketing operations role. This is not a task for the intern. ## The Hard Truth About Vanity Metrics We are not saying pageviews are useless. They are a leading indicator of reach. But they are not a performance metric. If your CEO asks why traffic dropped after a core update, the correct answer is not "we lost rankings." The correct answer is "we lost unqualified traffic that was not converting anyway." The shift to engagement and conversion metrics is not just about surviving algorithm updates. It is about building a marketing organization that can defend its budget with numbers that matter to the board. When you report CAC payback period and branded search growth, you are speaking the language of the CFO. When you report pageviews, you are speaking the language of 2015. The core update was a wake-up call. The agencies and in-house teams that pivot to measuring marketing success through engagement, conversions, and brand lift will not just survive the next update. They will thrive because they will be building assets that algorithms reward and customers trust. ## FAQ **Q: Should I ignore pageviews entirely?** No. Use them as a secondary signal for content reach and SEO health. Just stop treating them as the primary KPI for performance. Watch the trend, but do not make decisions based on the number alone. **Q: How long does it take to see results after switching to engagement metrics?** Expect a transition period of 60 to 90 days. You need to collect baseline data on the new metrics, adjust your content strategy, and let the analytics tools settle. Do not panic if the new numbers look worse initially. They are more honest. **Q: What is the single most important metric for a B2B company?** CAC payback period. It tells you if your marketing is generating cash or burning it. If that number is healthy, everything else is a detail. If it is not, no amount of pageviews will save you. ## Related on this site - [How to Choose a Digital Marketing Agency That Survives Google Algorithm Updates](/dgtg/blog/how-to-choose-a-digital-marketing-agency-that-survives-google-algorithm-updates) - [10 Martech and AI Tools That Will Transform Your 2026 Marketing Strategy](/dgtg/blog/10-martech-and-ai-tools-that-will-transform-your-2026-marketing-strategy) - [The Future of Marketing: 5 Trends and Predictions for 2026](/dgtg/blog/the-future-of-marketing-5-trends-and-predictions-for-2026)

Frequently asked questions

Q: Should I ignore pageviews entirely?

No. Use them as a secondary signal for content reach and SEO health. Just stop treating them as the primary KPI for performance. Watch the trend, but do not make decisions based on the number alone.

Q: How long does it take to see results after switching to engagement metrics?

Expect a transition period of 60 to 90 days. You need to collect baseline data on the new metrics, adjust your content strategy, and let the analytics tools settle. Do not panic if the new numbers look worse initially. They are more honest.

Q: What is the single most important metric for a B2B company?

CAC payback period. It tells you if your marketing is generating cash or burning it. If that number is healthy, everything else is a detail. If it is not, no amount of pageviews will save you.